Netflix Viewing Trends Analysis
This comprehensive dashboard visualizes Netflix content distribution, genre popularity, global reach, and content growth patterns, providing key insights into the streaming platform's catalog and performance.
Content Distribution
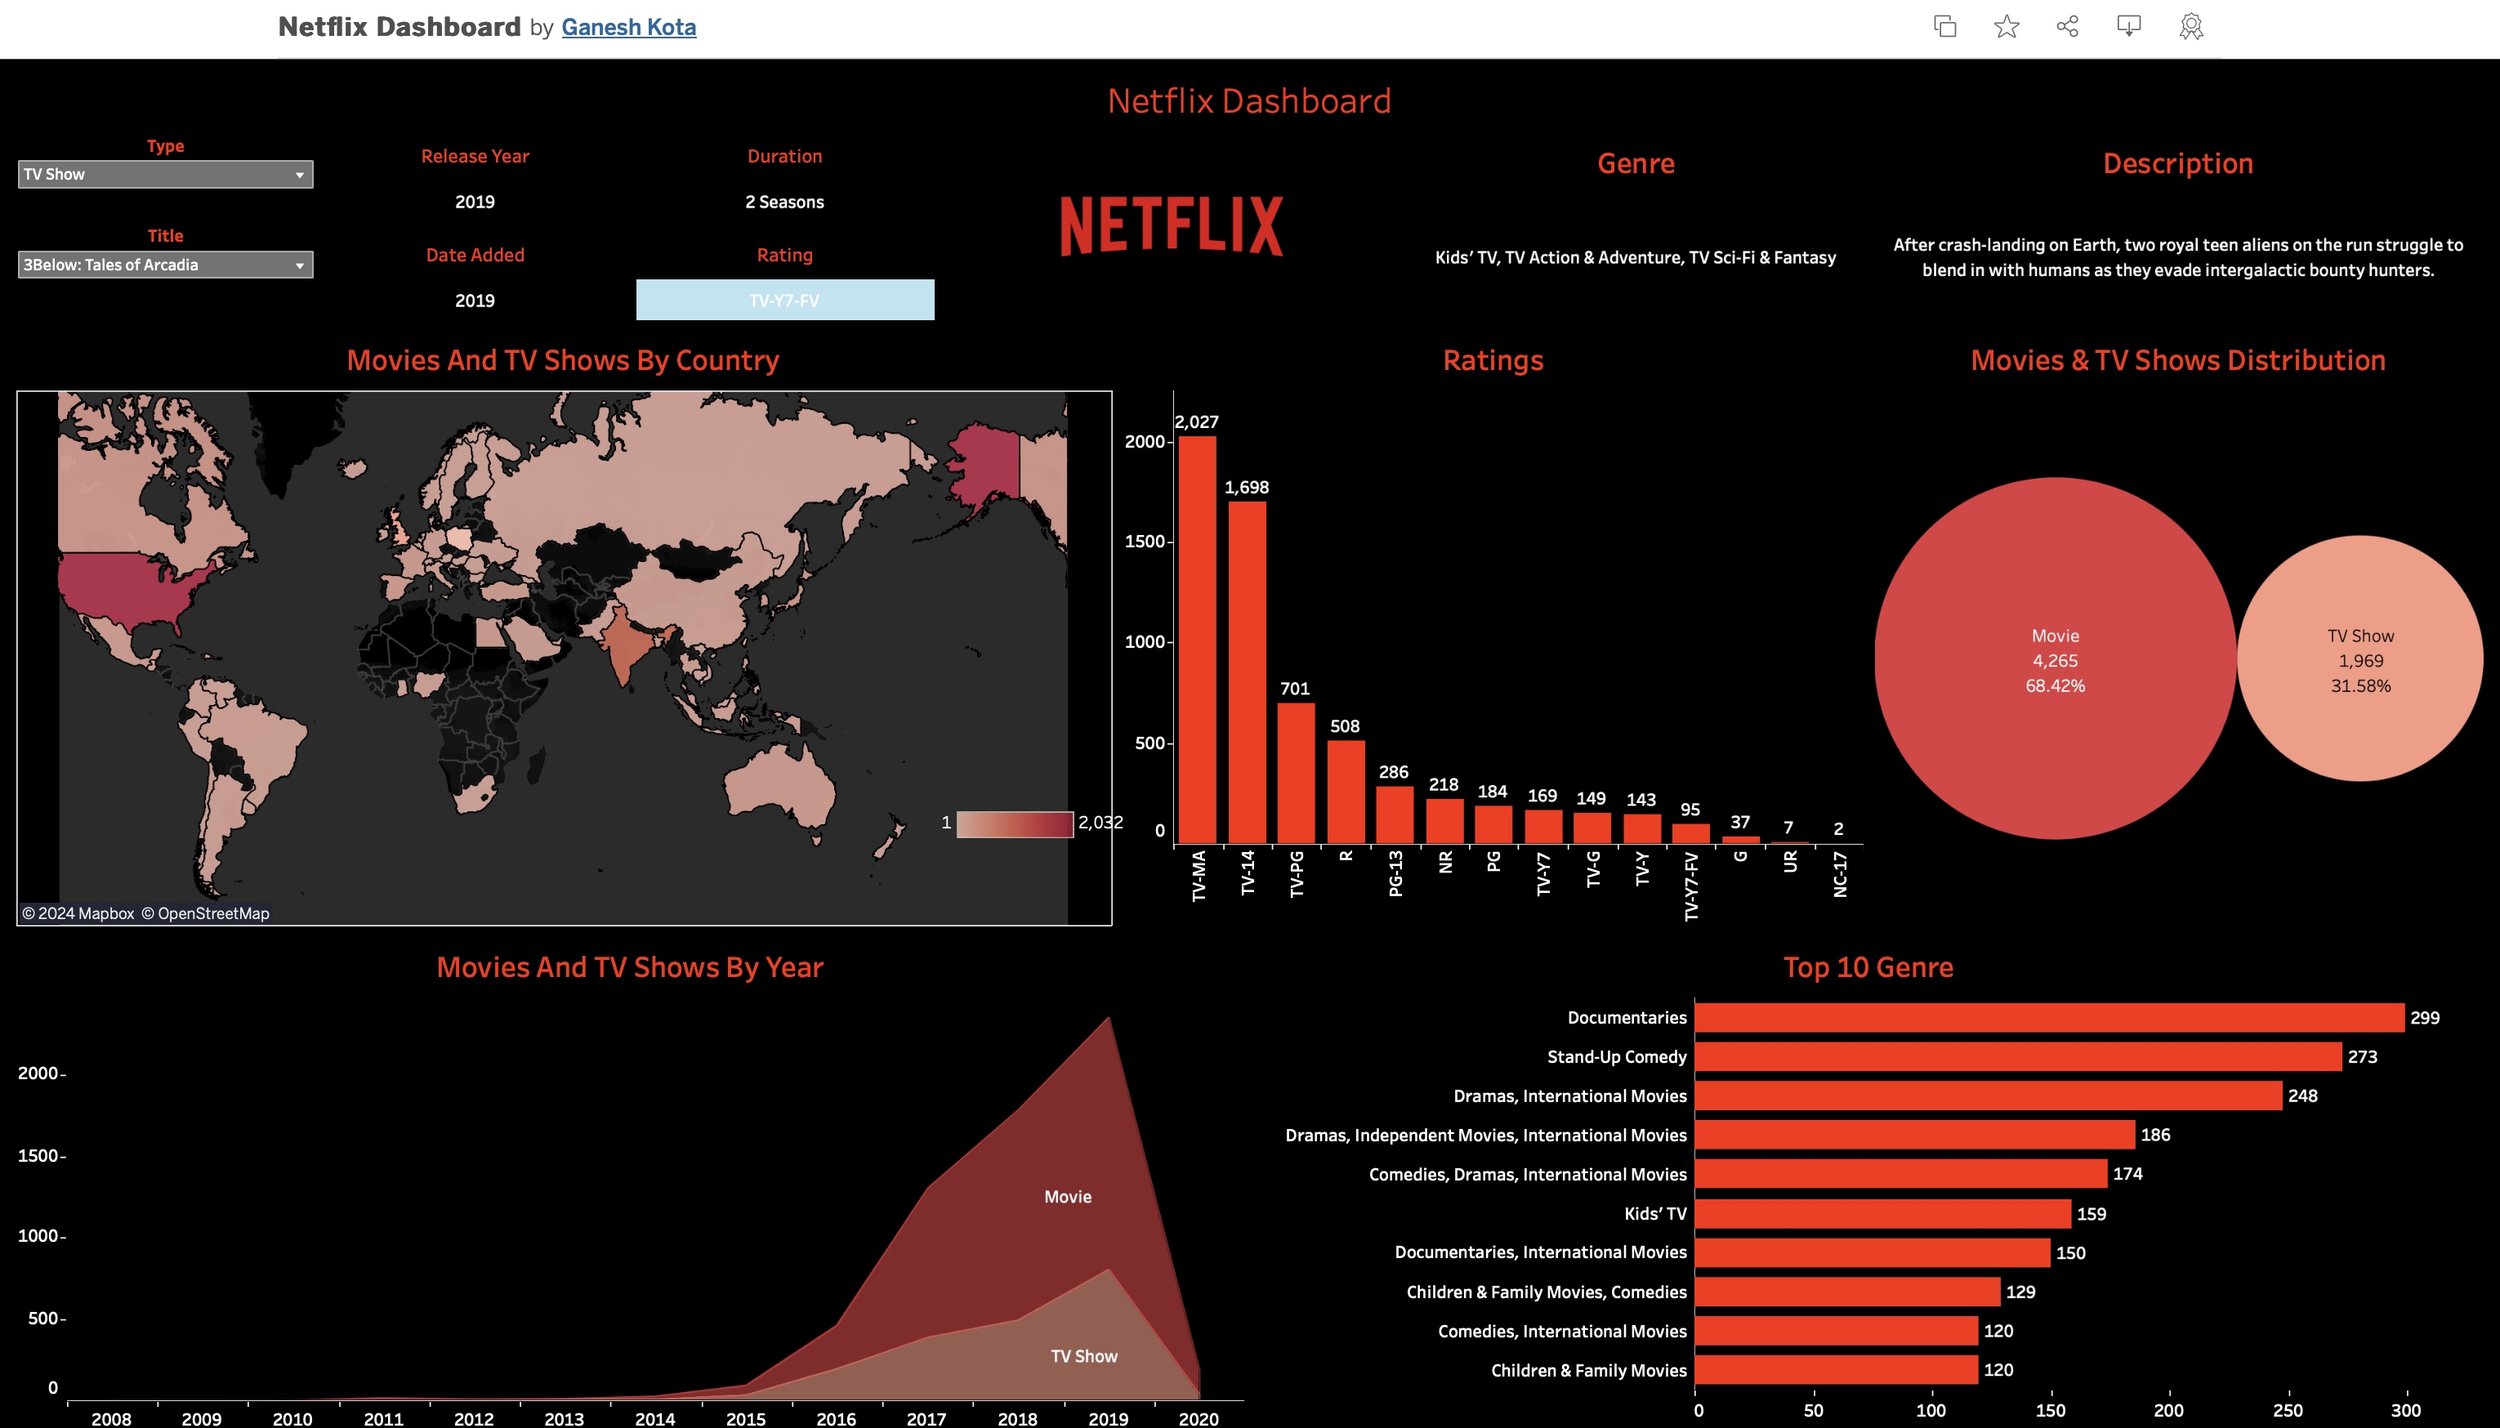
Format Breakdown: Movies dominate the catalog at 68.42% (4,265 titles) compared to TV Shows at 31.58% (1,969 titles)
Geographic Presence: United States leads content production with 2,027 titles, followed by India (1,698) and United Kingdom (701)
Growth Trajectory: Significant catalog expansion observed from 2015-2019, with steady growth in both movies and TV shows
Genre Analysis
Top Genres: Documentaries lead with 299 titles, followed by Stand-Up Comedy (273) and International Movies (248)
Content Diversity: Strong representation of international content across multiple genres
Family Content: Children & Family category shows substantial presence with 249 combined titles across categories
Rating Distribution
Content Ratings: TV-MA, TV-14, and TV-PG represent the most common rating categories
Targeted Demographics: Balanced catalog serving both mature audiences and family viewers
International Ratings: Global diversity reflected in rating system distribution
Key Insights
Interactive Features
Geographic Visualization: Heat map showing content distribution by country of origin
Temporal Analysis: Year-over-year content growth trends displayed with type differentiation
Genre Breakdown: Comprehensive top 10 genre representation with precise title counts
Content Filters: Interactive selection by show type, title, and other attributes
Technologies Leveraged
Power BI, Geographical mapping, Custom visualization techniques
Interactive filtering capabilities, Responsive design elements